
Some years ago, I published a paper with Tony Atkinson looking at trends in Australian top incomes since 1921. We’ve now updated the results to the 2007-08 tax year (the latest available from the ATO). Here’s the Excel spreadsheet. The ANU media release is over the fold.
Top Earners Getting More Milk From the Cash Cow
Australia’s top earners have increased their share of income more than three fold over the last three decades, according to new research from The Australian National University.
The study, conducted by ANU economist Professor Andrew Leigh from the Research School of Economics, in conjunction with Oxford University’s Sir Tony Atkinson, used taxation statistics to estimate the share of income held by the rich between 1921 and 2007.
The researchers also found that the income share of the country’s best paid workers was rising at a rate far outpacing ordinary workers.
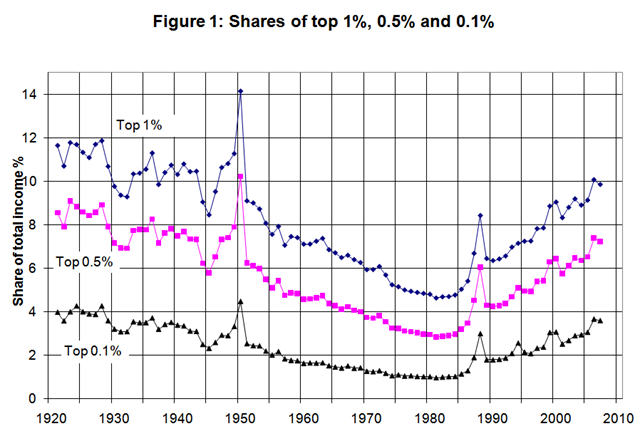
“The income share of the richest one per cent (those earning more than $197,000 in 2007) declined from 1921 to 1980, and has risen since then. In 1980 the top one per cent had five times their share of household income. Now, the same group has 10 times their share of household income.
“This pattern is even starker among the top 0.1 per cent (those earning more than $693,000 in 2007) whose share of household income has more than tripled since 1980,” said Professor Leigh.
He added that the patterns reflected figures about the pay of the country’s CEOs, High Court judges and top public servants.
“From 1993 to 2009, the pay of top-100 CEOs rose twice as fast as the salary of ordinary workers. In that period, the average earnings of CEOs rose by an average of 7.5 per cent per year. Over the same period, average salaries across the economy rose by an average of 3.7 per cent per year.
“In 1993, the average earnings of CEOs in the top 100 Australian firms was about $1 million. By 2009 this had risen to around $3 million.
“The salaries of High Court Judges and the country’s top public servants have also risen faster than average earnings,” he said.
Using newly available taxation statistics and CEO pay data, the study updates results that were first published in 2003. “Several factors drove the increase in inequality. These include internationalisation of labour markets for executives, technological change, and lower marginal tax rates,” he added.
Methodology
· The study combines taxation data with external information (such as population totals, and the total personal income if everyone was required to file a tax return), in order to calculate the share of income held by particular top income groups.
· A potential drawback of this approach is tax avoidance or evasion. For the most part, studies suggest that this is relatively small, and has little impact on trends in top incomes.
· For simplicity, I refer to tax years using their start date (eg. what I call 2007 is the tax year 2007-08).
Top 10 per cent
· In 2007, the cut off for entry into the top 10 per cent was individual income of $73,000.
· In 1941, the top 10 per cent had 34 per cent of all household income. This dropped steadily until 1980, when that group had 25 per cent of household income. Over the past generation, it has risen again, and the top 10 per cent now has 32 percent of household income.
Top 1 per cent
· In 2007, the cut off for entry into the top 1 per cent was individual income of $197,000.
· In 1921, the top 1 per cent had 12 per cent of all household income. Again, this dropped steadily until 1980, when that group had 5 per cent of household income. In 2008, the top 1 per cent had 10 per cent of household income.
· Salary earnings comprised 6/10ths of top 1 per cent incomes in the late-1990s, but only 4/10ths by the late-2000s.
Top 0.1 per cent
· In 2008, the cut off for entry into the top 10 per cent was individual income of $693,000.
· In 1921, the top 0.1 per cent had 4 per cent of all household income. By 1980, that group had just 1 per cent of household income. In 2007, the top 0.1 per cent again had 4 per cent of household income.
CEO Pay
· Over the period 1993-2009, the average earnings of CEOs in the top 100 Australian firms rose by an average of 7.5 per cent per year (Productivity Commission, Executive Remuneration in Australia, p.61). Over the same period, average salaries across the economy rose by an average of 3.7 per cent per year.
· In 1993, the average earnings of CEOs in the top 100 Australian firms was about $1 million. By 2009, this had risen to around $3 million.
Other top groups
· The salaries of High Court Judges and top public servants have followed a similar trajectory.
All data are available in spreadsheet form at http://andrewleigh.org/

Very interesting.
Any idea what the historical reason is behind the sudden spike and drop from 1945-1950? Some kind of effect of demobilising the war economy?
LikeLike
great work.
LikeLike
Andrew it would be very informative to see what fraction of the population earnt each 5% of wealth.
Based on the numbers and the chart you show, it seems to me that pretty much all the growth in share of total income that occurs for the top 10% actual occurs in the top 1% subset.
Can you break-out the numbers into 0-0.1%, 0.1%-1%, 1%-10%, 10%-?.
I seem to remember a similar study for the US which appeared to show that the top 10 or15% of asset holders were gaining a much larger share of the national assets, but the detail was the actually the bottom 80% had shrunk. Those from 5-20% had stayed the same. 1-5% had increased slightly. Almost all of the gain had been by the top 1% or less of the population.
LikeLike
James, there’s a Korean War wool boom – documented in more detail in the 2006 paper. That’s probably the spike you have in mind.
Chris, thanks for the kind words here and on your own blog.
M, the subgroups you mention can readily be calculated from the spreadsheet. Eg. (0.1%-1%)=1% minus 0.1%. We didn’t go further down the distribution because it limits the timespan that we can analyse. But I do have related work (www.andrewleigh.org) estimating male ginis using tax data, on the basis that most males have paid tax since WWII.
LikeLike
Thanks Andrew!
LikeLike